ISIS-II Photometer History
Overview
Though all the instruments on the ISIS-II space probe carried great importance, the Scanning Auroral Photometer was pivotal for Canada and specifically the University of Calgary’s budding Space Physics program. The wavelengths specifically investigated were that of the 1S to 1D atomic oxygen emission at 5577 Å and the 0-0 band of the first negative system of singly ionized molecular nitrogen at 3914 Å.
The ISIS-II satellite had a near-polar orbit of 1400 km altitude and viewed a region of more than 4000 km. Various field of view (FOV) considerations needed to be made to ensure optimal data collection. The smallest possible FOV was desired because it provided the most information, however, as the angle defining the field of view gets too small then the amount of light collected for a given amount of time is decreased. Naturally, the way to solve this issue would be to spend more time observing each element however, decreased FOV results in the observable area being split up into more elements. In order to meet the time constraint, the amount of time spent on each element has to be reduced to cover the full area; this unfortunately risks the quality of the data. To solve this contradiction and optimize the FOV, the signal-to-noise ratio (SNR) of the photometer was used to determine the ideal angle. As the FOV decreases, the SNR deteriorates, meaning that as the angle decreases then the quality of the data decreases because there is too much noise. The average output of one photoelectron pulse from each point of view should be obtained at the lowest airglow/auroral intensities for which the information is desired, this being approximately 250 Rayleighs. Using this conclusion, it was then found that a FOV of 0.4° produced an acceptable signal-to-noise ratio of 1.

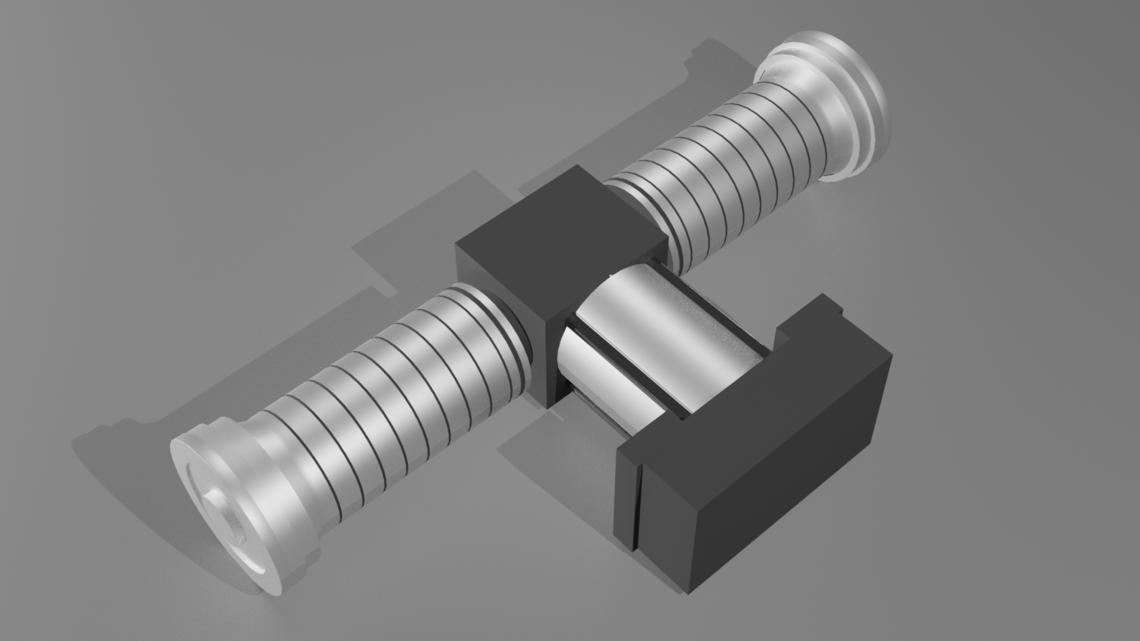
Above is a screen capture of a 3D model for the Auroral Photometer. To explore the details of the satellite, please click on the Photometer 3D Simulation button.
The ISIS-II photometer utilized an f/2 planoconvex lens with a positive focal length. A planoconvex lens is composed of one spherical and one flat surface combined. The lens was constructed from ultrapure quartz, also known as Suprasil. In order to minimize the effects of known uncertainties from the image dissector photomultiplier and to achieve the best possible baffling from the length available for the optics and baffle system, the smallest possible focal length was needed. However, there is another dilemma that presents itself if the focal length is too small. Spherical aberration from the lens becomes significantly large compared to the required resolution of 0.4° at low local lengths. An upside to the way the photometer was designed was that the interference filters, which were also made of Suprasil substrates, do not make use of any coloured glass, and therefore, chromatic aberration was neglected.
Before being able to understand how the scanning and data processing occurs, it is important to first understand a specific part of the photometer; the Image Dissector Photomultiplier. Its purpose is to measure the spectrum being observed and create an electron image of it. That image can then be scanned to produce a visual image electrically.
The scanning of Earth by the photometer was done with a combination of rotational and translational motions of the satellite, coupled with the internal scanning performed by the image dissector. The spacecraft remained essentially fixed in space as it orbited Earth; the rotation of the satellite resulted in the scanning of a strip at a right angle to the orbit plane. The width of the strip was chosen to be 5° so that the scanned strips would meet without overlapping. The image dissector divided the strips into resolved regions of 0.4° by 0.4° that were each scanned repetitively at high speed. Although there was a large effort to making sure that the scanned strips were contiguous, because of the coordination and timing of the satellite’s rotation and the image dissector scanning, there were still instances where substantial overlap was possible.
ISIS-II was able to collect immense amounts of data which was incredibly useful to any scientist studying it, however, such large amounts of data also meant that it was difficult to process, especially in a raw format. Therefore, in order to effectively interpret the satellite’s findings, the data was presented in pictorial form — this was the aim of the first data processing system. The heart of the data processing system is a PDP8/I computer with 12K of memory and the attached display system. Together, they continuously present the data composing the upper 8K of memory via a direct memory-access facility of the computer. The display generates a 16 by 1024 dot grid with each dot’s brightness being determined by the contents of the corresponding location in the computer’s memory. Each twelve-bit word in the memory contains two six-bit intensity values which therefore provides a 64-level grayscale for each point on the display.
After this step, the data was played back from a magnetic tape and reconstructed by a commercial bit synchronizer before the computer software would begin ordering the data, packing the format, and storing the refined data on digital magnetic tape. In this format, the data can be read back directly into memory where it would be displayed as a photo that could be inspected, photographed, or selectively printed. The system was able to display data from one rotation of the spacecraft at a time and because the data from one rotation appears on screen as a narrow strip, it was possible for data from an entire pass to be reproduced as one composite image by electronically positioning the data so that information from one rotation lay adjacent to that from the preceding rotation.
